Financials
What the Financials workspace is for
The Financials workspace provides an interactive view of your company’s Profit & Loss (P&L), Balance Sheet (BS), and Cash Flow (CF). It is designed for performance analysis, variance tracking, and drill-down into underlying accounts — all in one place.
Financials are a read-only analytical view; statement structure, mapping, and data are managed in Onboarding & Data.
TL;DR
Financial statements with full drill-down, rolling forecast logic, and flexible comparisons to plans.
How Financials works
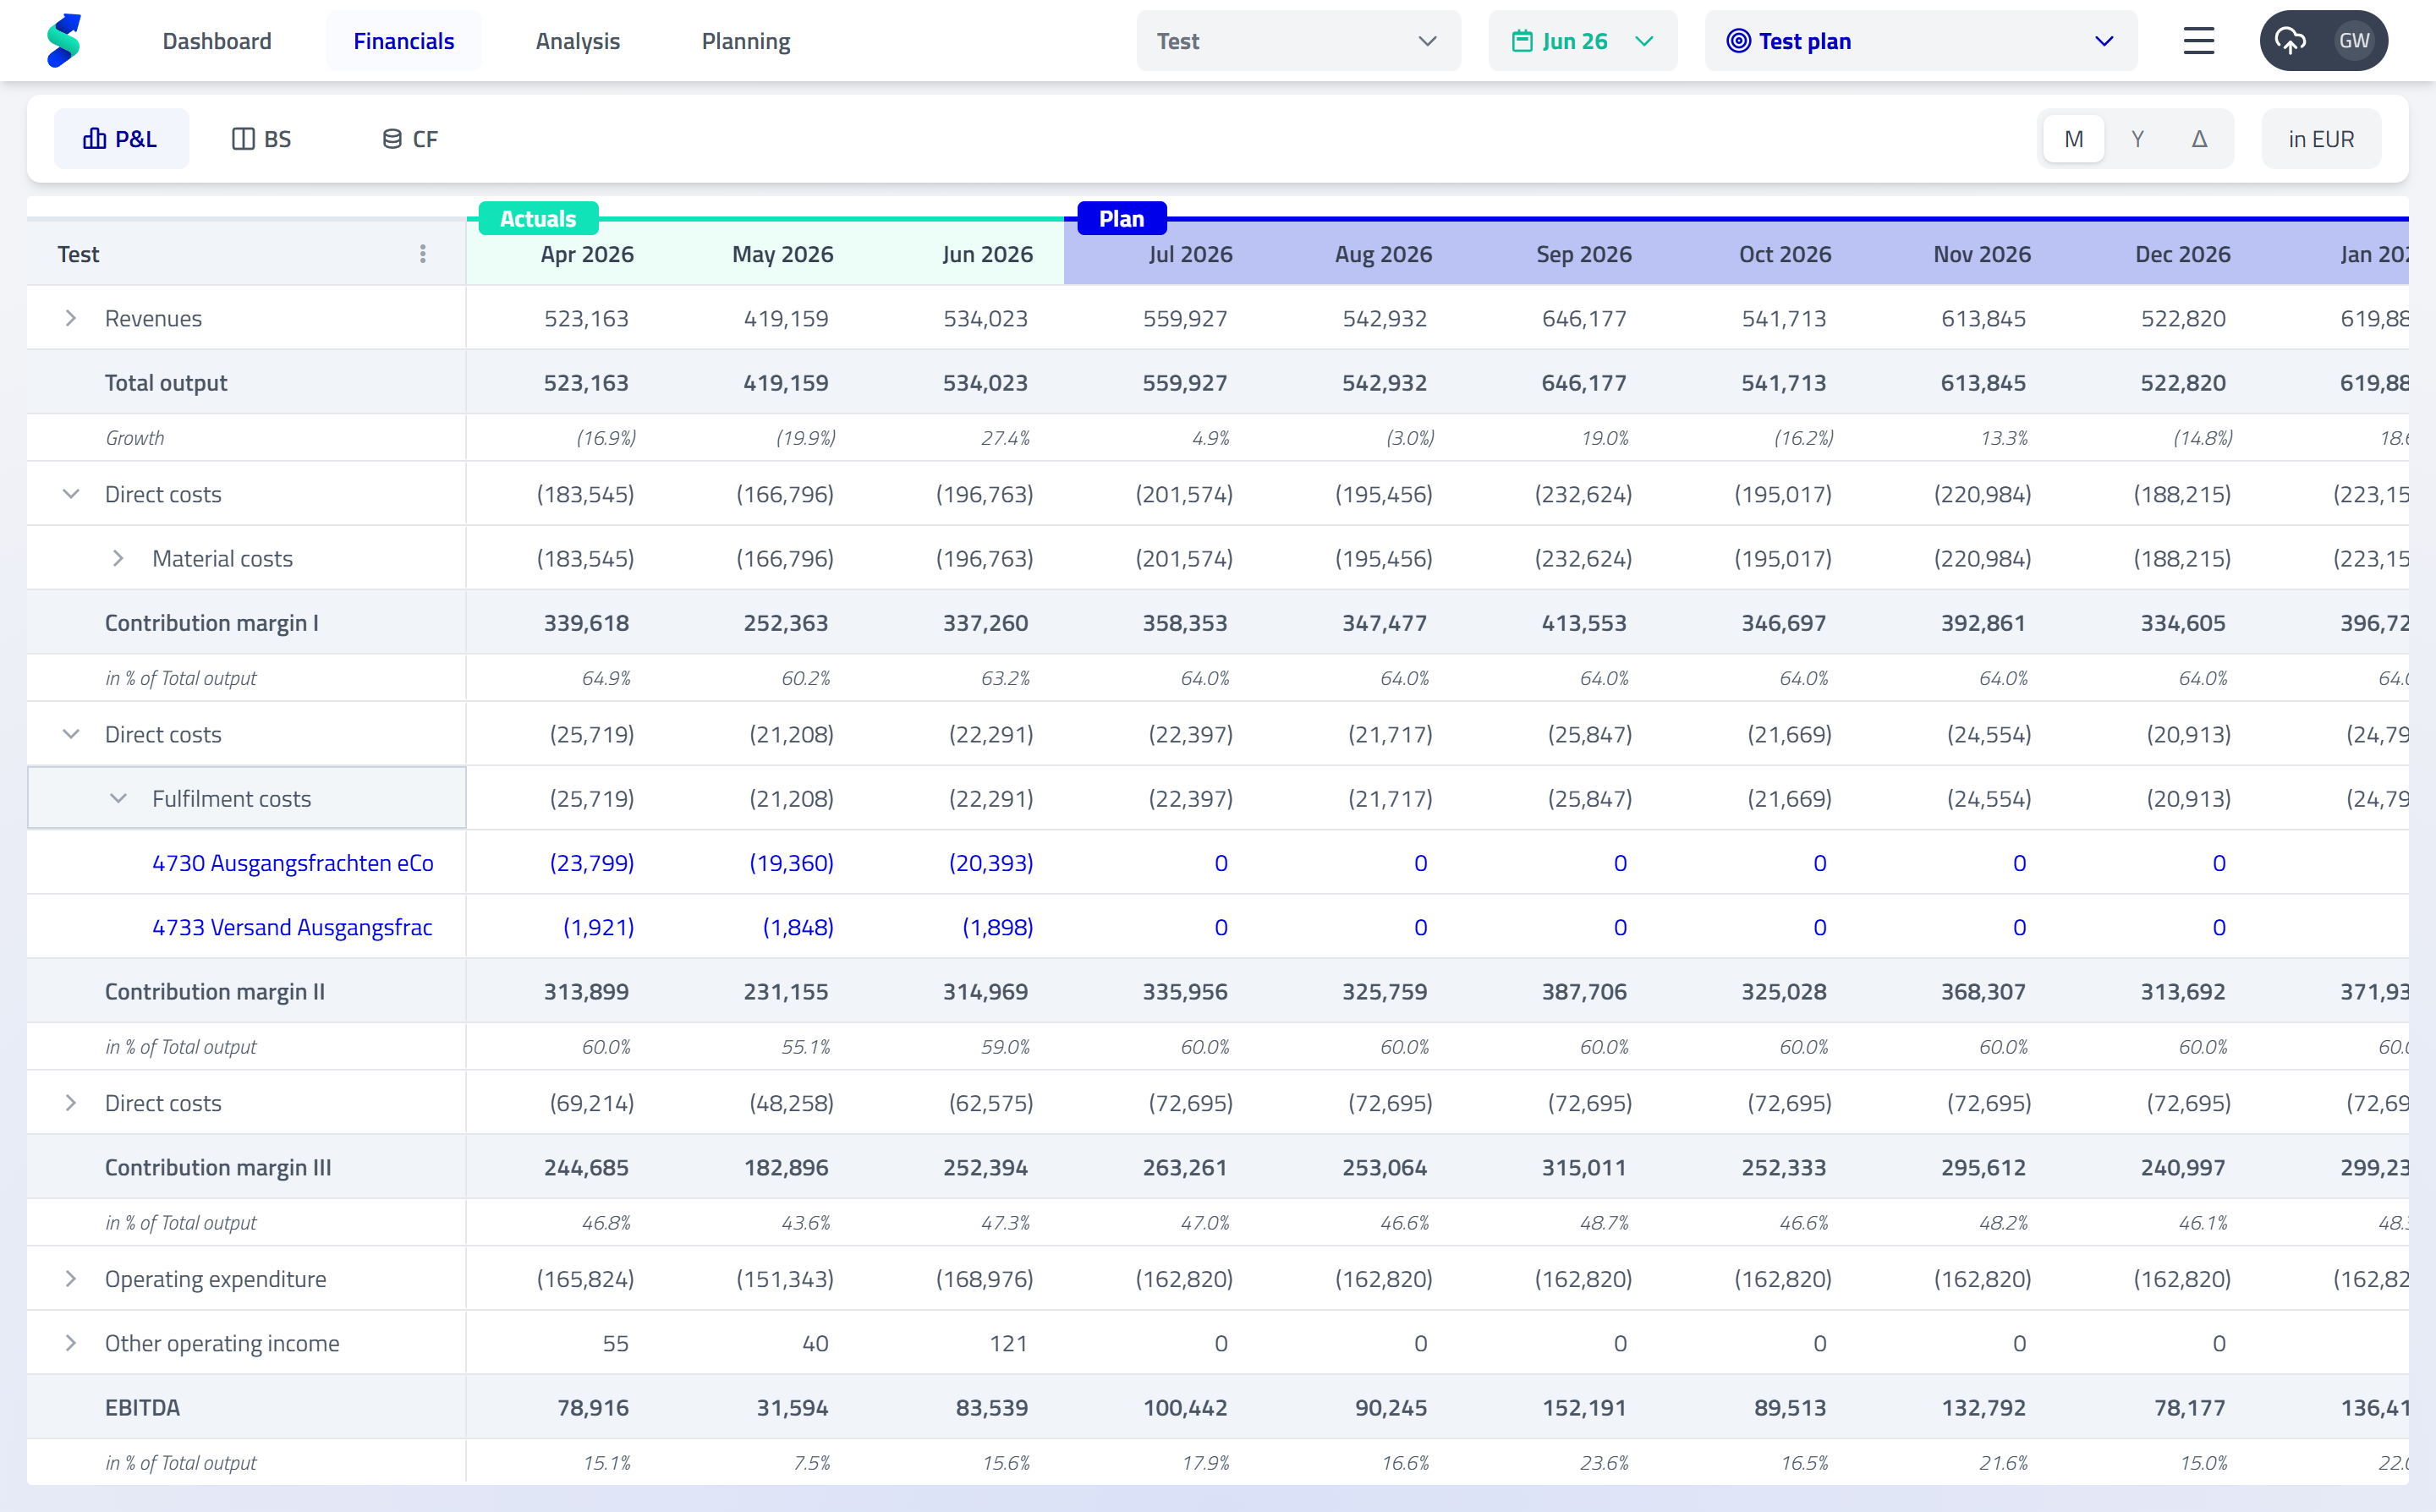
Financials always follow a rolling forecast logic based on the selected last actuals and an optional plan.
- All periods up to and including the selected last actuals show actual data
- All subsequent periods show plan values
- This results in a continuous, full-year view combining actuals and plan
If no plan is selected, Financials display actuals only.
Changes to last actuals or plan selection are applied immediately across all statements.
Compatibility warnings
If the selected last actuals and plan are not compatible, statycs shows a warning symbol next to the selected plan to indicate a potentially inconsistent setup (for example, when there are months between the selected last actuals and the plan start month).
Financials overview
Key capabilities
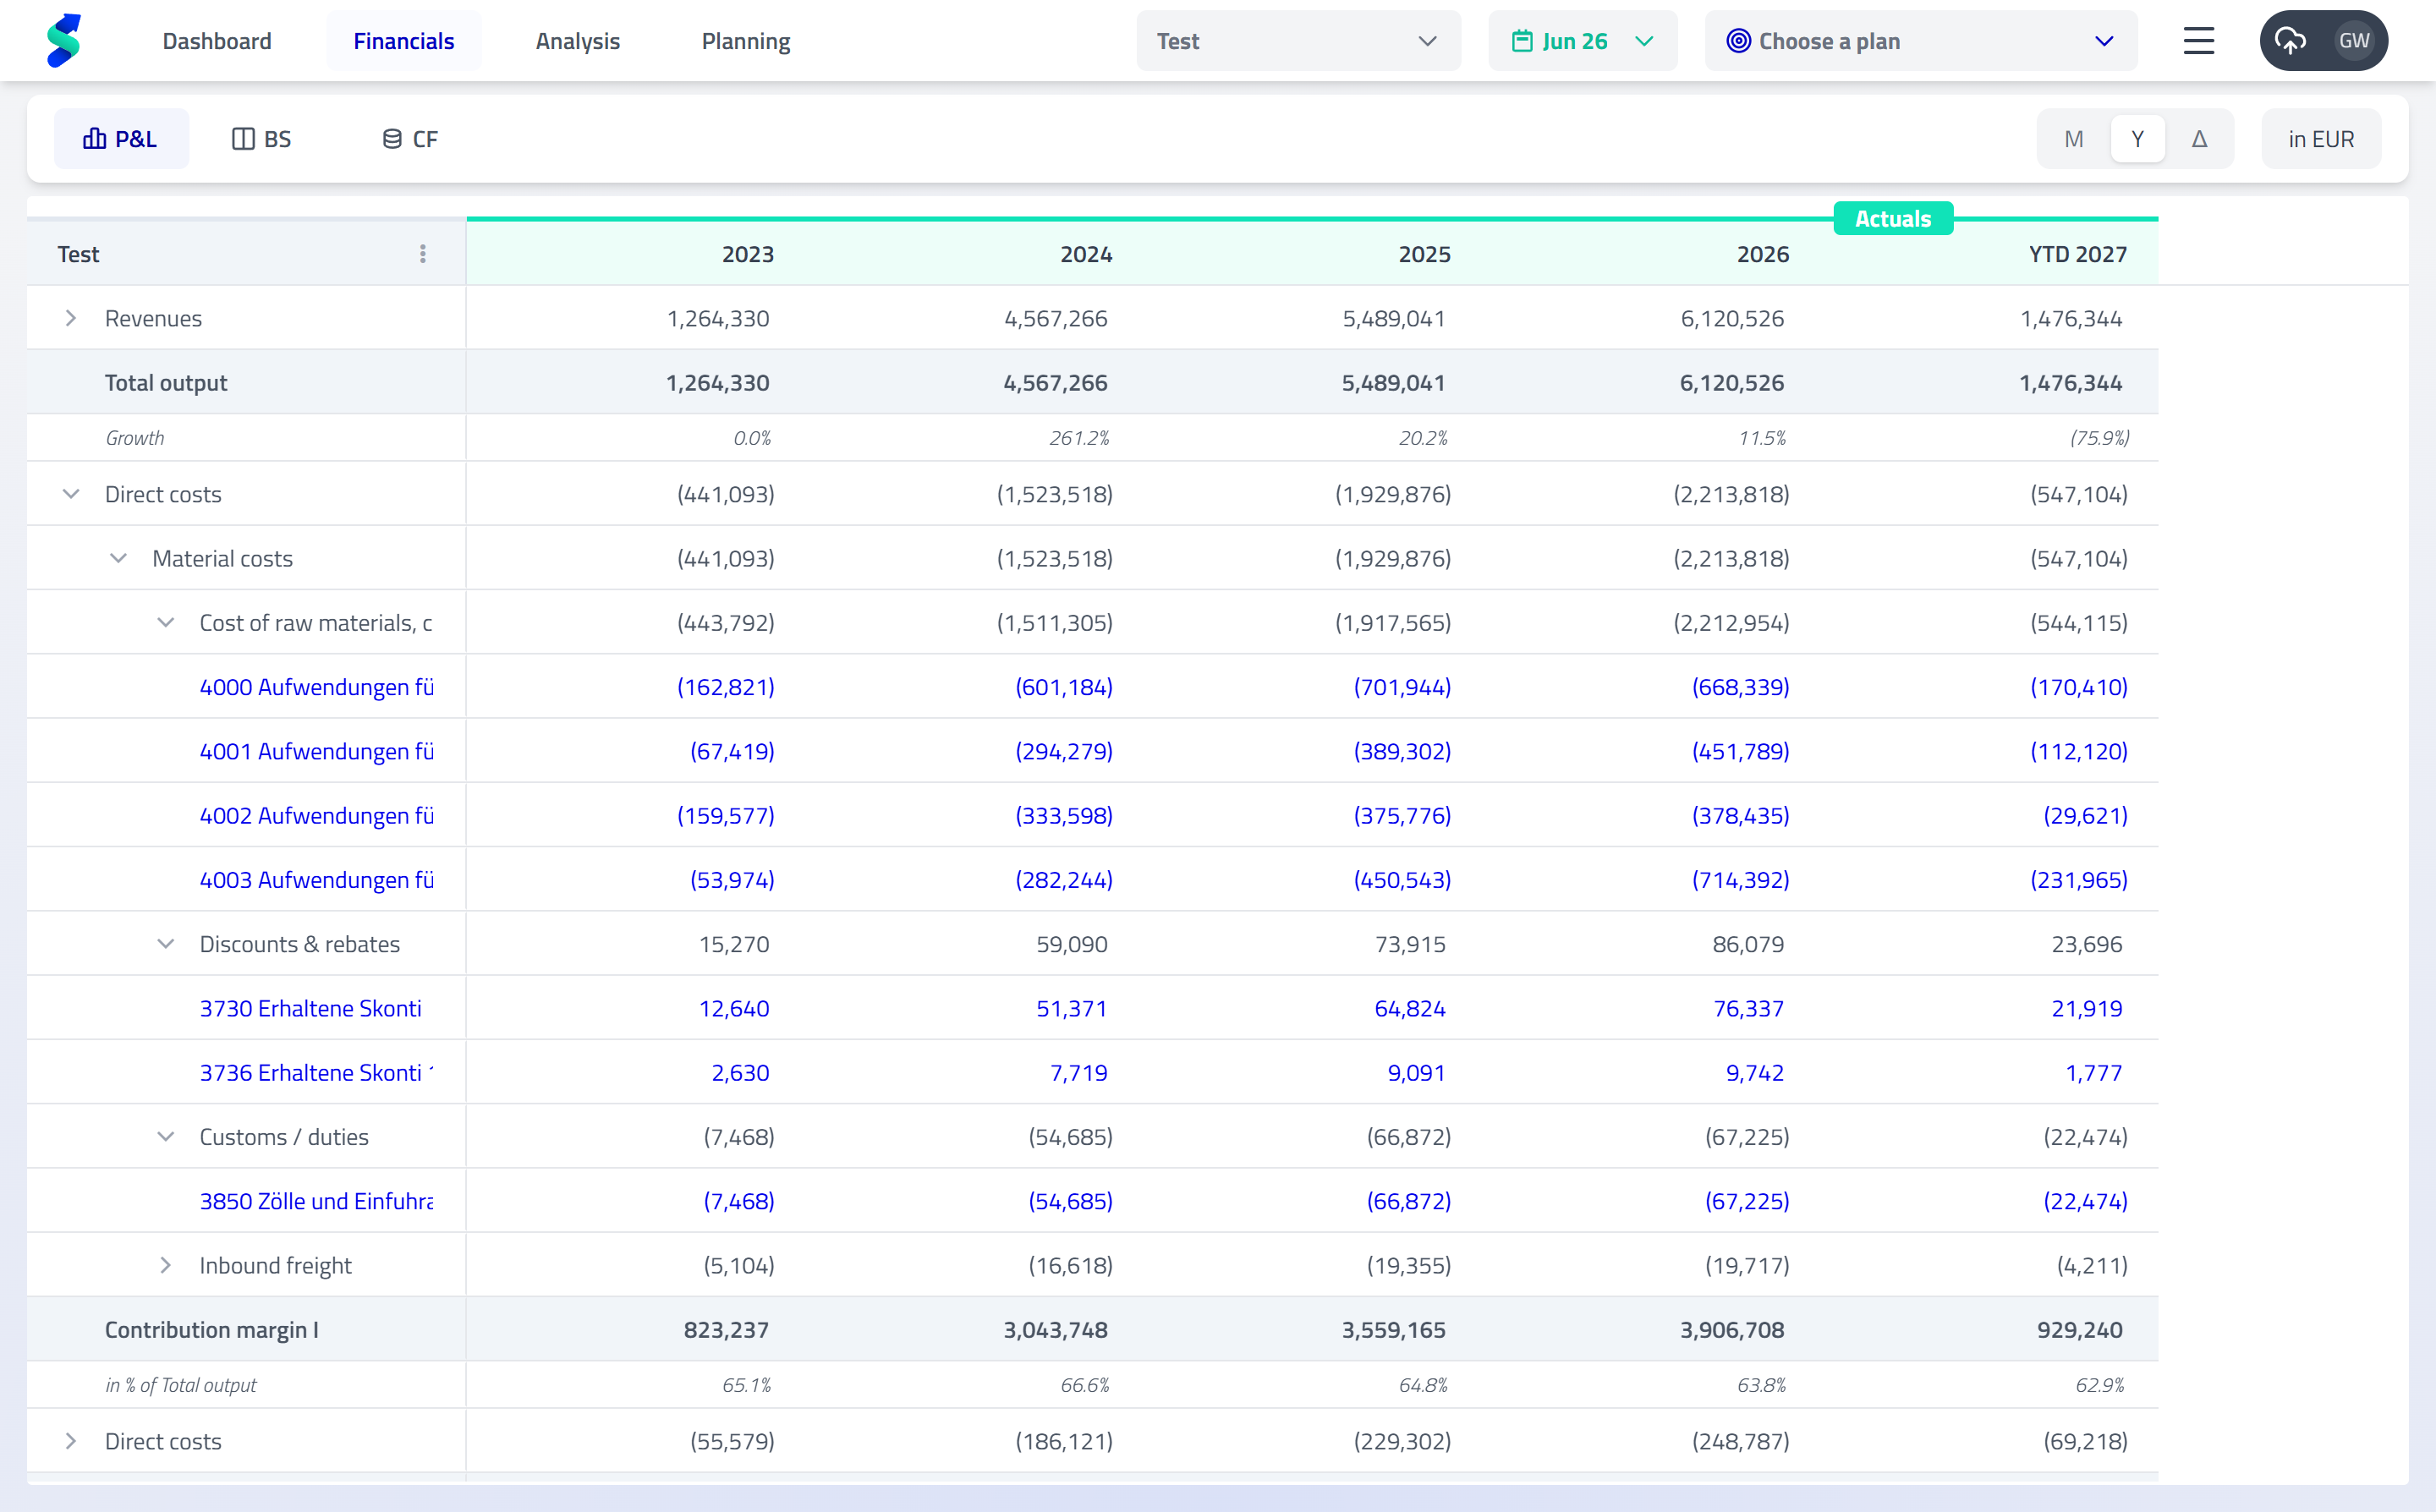
Timeframe views (Monthly / Yearly / Comparison)
Use the timeframe toggle (M / Y / Δ) in the header to switch between:
- Monthly – detailed month-by-month view
- Yearly – aggregated annual view
- Comparison – side-by-side comparison of two periods or ranges
Comparison view (step-by-step)
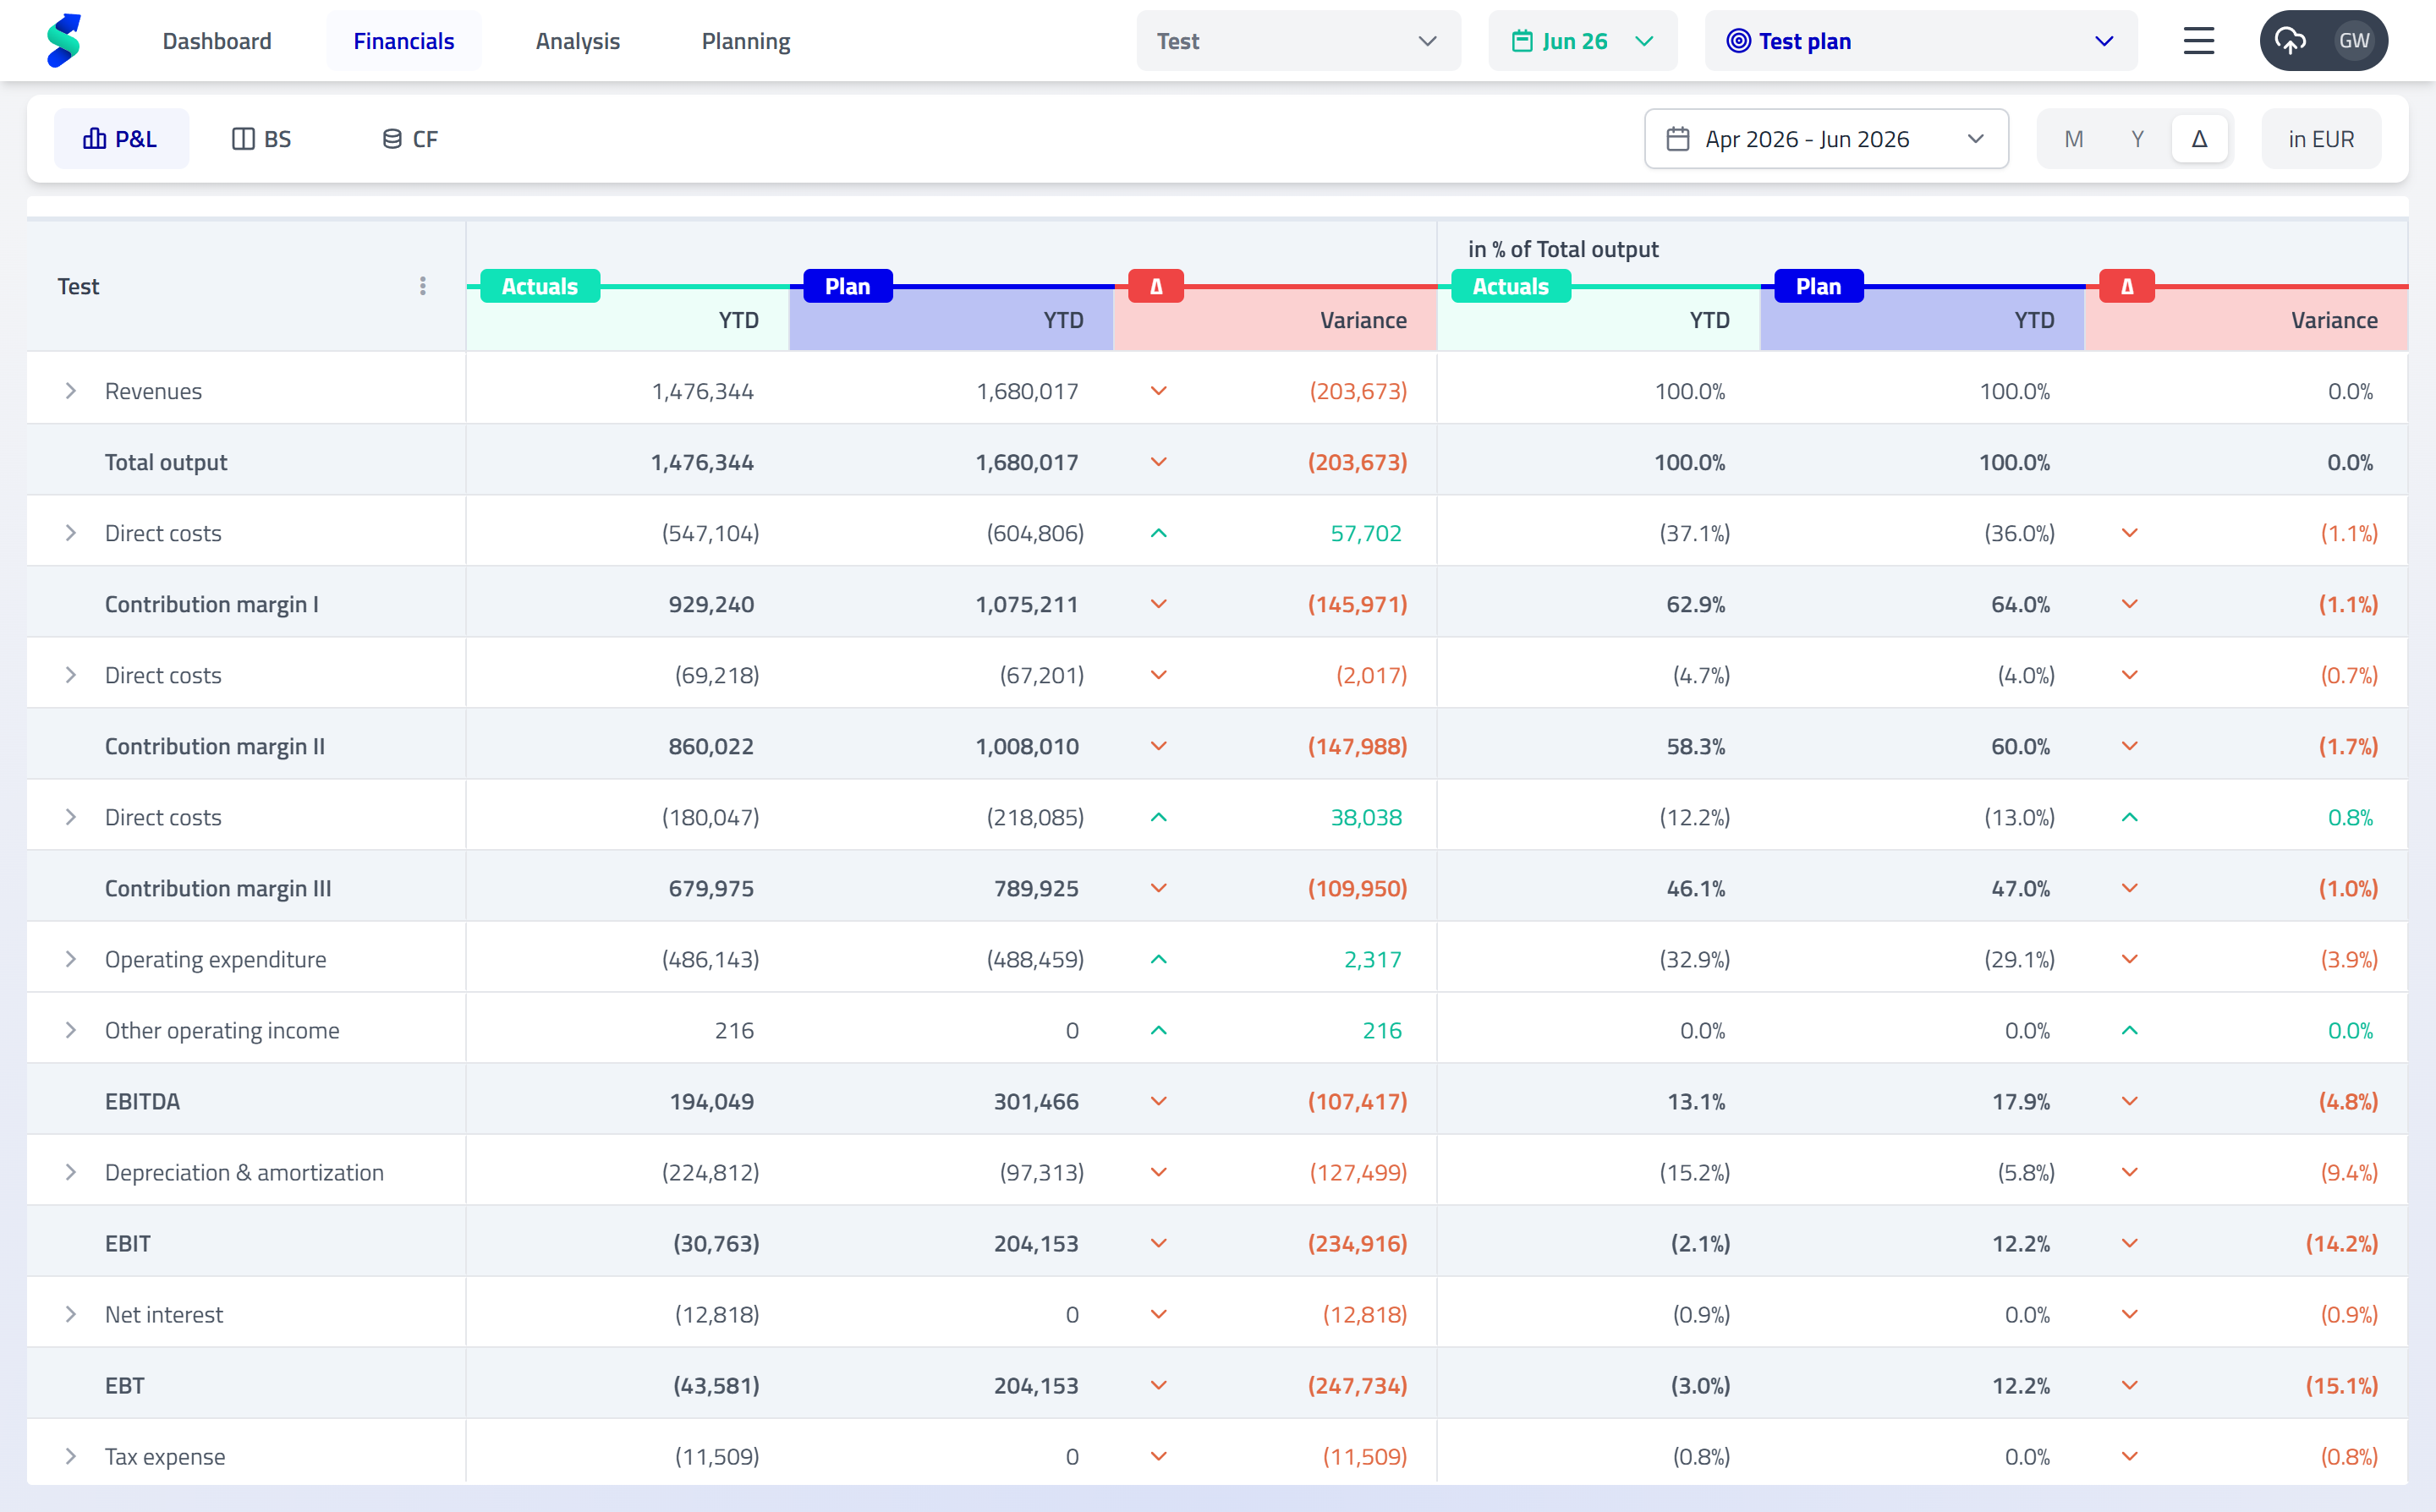
The Comparison view is optimized for fast setup and flexible analysis.
-
Open the range selector
Click the range selector to define the comparison periods. -
Choose what to compare
You can compare:
- Actuals vs. Plan
- Actuals vs. Actuals
- Default behavior (to reduce setup effort)
- Column 1 automatically selects:
- the corresponding plan period (if a plan is selected), or
- the previous year period (if no plan is selected)
- Column 2 can be changed manually:
- Reopen the range selector
- Select a different comparison period or range
This default setup allows you to open the Comparison view and see a meaningful comparison immediately, without manual configuration.
Plans & last actuals
- Add or select a plan:
Plan › + Add plan - Set last actuals:
Last actuals › Choose date
Image description:
Plan selection and last actuals controls used to define the active comparison plan and the cut-off between actuals and planning.
Rolling forecast logic
Financials always display a rolling forecast.
When last actuals move forward, statycs automatically adjusts:
- Retained earnings
- Profit and loss carry forward
- Cash balance
All other positions remain as planned.
Plans are used as comparison references (for example, Actuals vs. Plan) and do not change the rolling forecast logic itself.
Drill-down to account level
Click the ▶︎ icon on any row to expand step by step:
Subtotal → Level 1 → Level 2 → Account groups → Individual accounts
This allows you to move seamlessly from high-level results to the underlying drivers.
Configure what you see (⋮ menu)
Open the ⋮ menu in the top-left cell to customize the view.
Customization scope
All display settings are saved per user and per company and do not affect other users.
Image description:
The Financials ⋮ menu showing options for expanding/collapsing, display metrics, level visibility, hiding empty rows, and limiting the displayed actuals period.
Workflow tip
Need to adjust the financial statement structure or upload new monthly data?
Go to Onboarding & Data. Any confirmed changes there are reflected automatically in Financials.